Validation Curve Plot from GridSearchCV Results
For a course in machine learning I’ve been using sklearn’s GridSearchCV to find the best hyperparameters for some supervised learning models. I wanted to fix all but one of the hyperparameters to be set to the best_params_ values, and then plot the model’s performance as a single parameter was varied. It can be time consuming to run those experiments directly with modelselection.validation_curve(), and the search grid already contains scores for various parameter values. I found examples of plotting the grid’s cv_results_ when a couple of parameters are considered, but some of my grid searches were over more parameters that I wanted to plot.
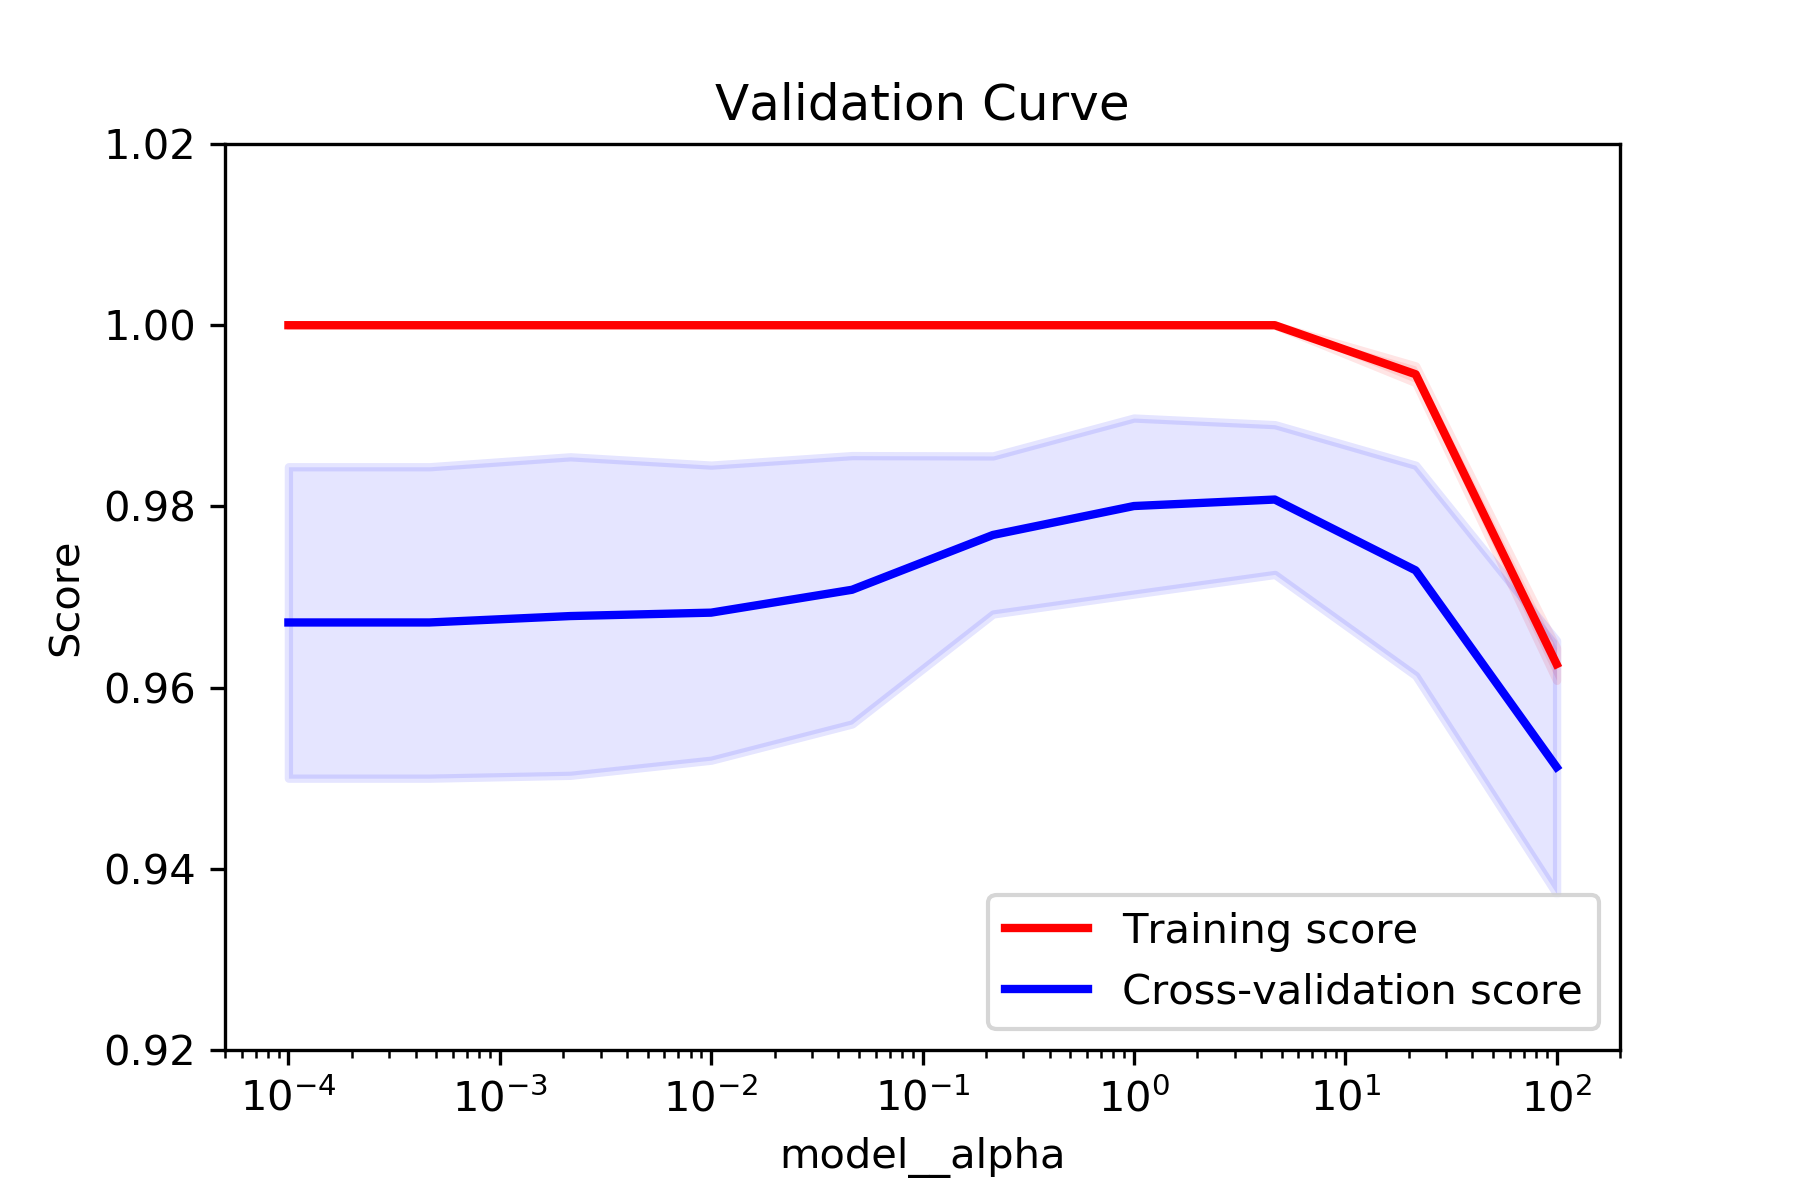
So I wrote this function which will plot the training and cross-validation scores from a GridSearchCV instance’s results:
def plot_grid_search_validation_curve(grid, param_to_vary,
                                      title='Validation Curve', ylim=None,
                                      xlim=None, log=None):
    """Plots train and cross-validation scores from a GridSearchCV instance's
    best params while varying one of those params."""

    df_cv_results = pd.DataFrame(grid.cv_results_)
    train_scores_mean = df_cv_results['mean_train_score']
    valid_scores_mean = df_cv_results['mean_test_score']
    train_scores_std = df_cv_results['std_train_score']
    valid_scores_std = df_cv_results['std_test_score']

    param_cols = [c for c in df_cv_results.columns if c[:6] == 'param_']
    param_ranges = [grid.param_grid[p[6:]] for p in param_cols]
    param_ranges_lengths = [len(pr) for pr in param_ranges]

    train_scores_mean = np.array(train_scores_mean).reshape(*param_ranges_lengths)
    valid_scores_mean = np.array(valid_scores_mean).reshape(*param_ranges_lengths)
    train_scores_std = np.array(train_scores_std).reshape(*param_ranges_lengths)
    valid_scores_std = np.array(valid_scores_std).reshape(*param_ranges_lengths)

    param_to_vary_idx = param_cols.index('param_{}'.format(param_to_vary))

    slices = []
    for idx, param in enumerate(grid.best_params_):
        if (idx == param_to_vary_idx):
            slices.append(slice(None))
            continue
        best_param_val = grid.best_params_[param]
        idx_of_best_param = 0
        if isinstance(param_ranges[idx], np.ndarray):
            idx_of_best_param = param_ranges[idx].tolist().index(best_param_val)
        else:
            idx_of_best_param = param_ranges[idx].index(best_param_val)
        slices.append(idx_of_best_param)

    train_scores_mean = train_scores_mean[tuple(slices)]
    valid_scores_mean = valid_scores_mean[tuple(slices)]
    train_scores_std = train_scores_std[tuple(slices)]
    valid_scores_std = valid_scores_std[tuple(slices)]

    plt.clf()

    plt.title(title)
    plt.xlabel(param_to_vary)
    plt.ylabel('Score')

    if (ylim is None):
        plt.ylim(0.0, 1.1)
    else:
        plt.ylim(*ylim)

    if (not (xlim is None)):
        plt.xlim(*xlim)

    lw = 2

    plot_fn = plt.plot
    if log:
        plot_fn = plt.semilogx

    param_range = param_ranges[param_to_vary_idx]
    if (not isinstance(param_range[0], numbers.Number)):
        param_range = [str(x) for x in param_range]
    plot_fn(param_range, train_scores_mean, label='Training score', color='r',
            lw=lw)
    plt.fill_between(param_range, train_scores_mean - train_scores_std,
                     train_scores_mean + train_scores_std, alpha=0.1,
                     color='r', lw=lw)
    plot_fn(param_range, valid_scores_mean, label='Cross-validation score',
            color='b', lw=lw)
    plt.fill_between(param_range, valid_scores_mean - valid_scores_std,
                     valid_scores_mean + valid_scores_std, alpha=0.1,
                     color='b', lw=lw)

    plt.legend(loc='lower right')

    plt.show()
plot_grid_search_validation_curve(grid__digits, 'model__alpha', log=True, ylim=(.92, 1.02))